Does It Work? Productivity, Quality and the Evidence for Algorithmic Management
The earlier chapters of Part III asked what algorithmic management does to people's autonomy, fair treatment, privacy and health. This chapter asks the question on which the case for algorithmic management rests: whether it delivers better work, and over what period the evidence for that was gathered. It concerns three management functions: M1 Direction, where systems assign, sequence and pace work; M2 Evaluation, where they measure and rate it; and M4 Development, where the question is whether people still learn the work, and the managers of tomorrow still learn to manage, when a system does part of the managing. It answers open question Q4 of the series, raised in AI Threat, Chapter 14: whether algorithmic management works when it is measured over years rather than quarters, in quality, health and retention as well as in output (44, Nordqvist, 2026).
A business case for a rostering system or a work-allocation agent promises a return that is usually checked after a quarter, against the measure the system was built to move. If the costs arrive later and elsewhere, in claims that reopen, staff who leave or a team leader who never learnt to allocate work, the organisation records a gain and pays for a loss without connecting the two. The chapter builds on the conclusions that automation erodes the skills of the people who must catch its errors, with a team-level oversight-quality metric part of the remedy (F66; AI Threat, Chapters 6 and 14) (44, Nordqvist, 2026), and on the rule that every outlook is labelled observable, expected or speculation (F32; AI Governance, Chapter 22) (41, Nordqvist, 2026).
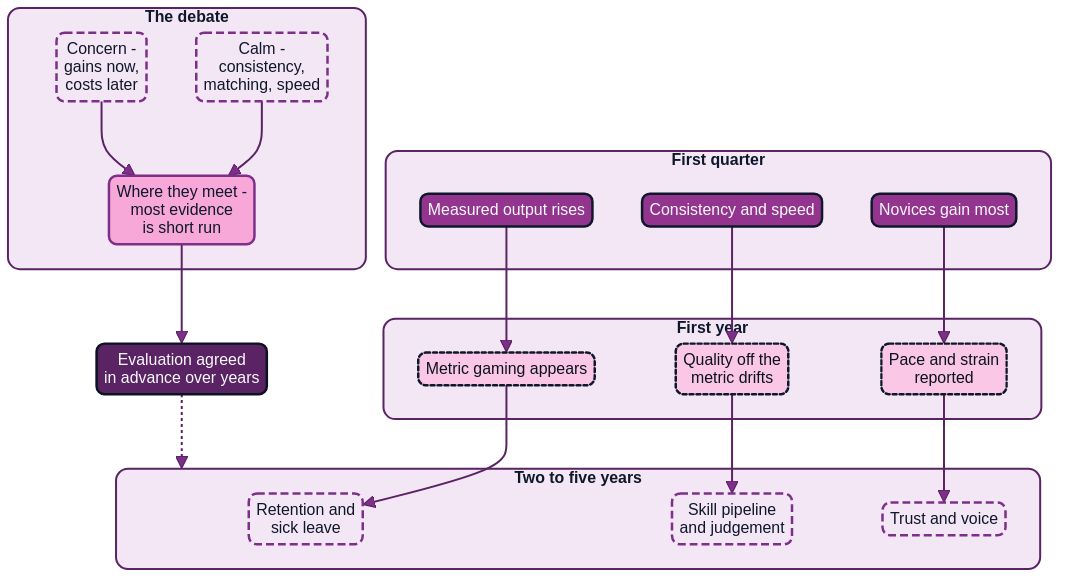
Figure 15.1: What is measured in the first quarter is not what decides the result over years; the debate meets on the need for evaluation designs agreed before deployment.
What counts as working
The definition of working usually arrives with the system. A routing system is judged by visits per hour, a claims-allocation agent by claims closed, a screening module by time to hire. Those are legitimate measures of what the system was built to move, but they measure output over a short horizon, and they are the measures most likely to rise when a system is introduced.
This chapter uses six outcomes and asks of each study which of them it measured:
- Output: work completed per unit of time or cost, such as visits per paid hour.
- Quality: whether the work was done well, measured independently of the output metric, such as reopened claims or missed visits.
- Safety and health: injuries, sick leave, strain and pace, the outcomes of Chapter 14.
- Retention: whether people stay.
- Learning: whether workers and managers keep the skill to do the work, and to catch the system's errors, without it.
- Fairness and trust: whether outcomes differ unjustifiably between groups, and whether people believe the system and its users.
Two distinctions run through the evidence. The first is the horizon: a quarter, a year or several years. Output effects show in weeks, retention in a year or more, learning and the pipeline of future managers in several. The second is the source: a measured outcome, a randomised or quasi-experimental comparison, or a perception reported in a survey. They answer different questions, and much of the public debate on algorithmic management confuses them.
The OECD defines algorithmic management as the use of software, which may include AI, to fully or partially automate tasks traditionally carried out by human managers (149, Milanez et al., 2025). Much of the best-measured evidence below concerns AI that assists workers rather than AI that manages them. It is included because it is the closest controlled evidence available, and because an assistant that drafts the answer also shapes the pace and method of the work, a form of M1 Direction.
The evidence
Monitoring: what changed when the restaurant was watched
The most cited study of monitoring and productivity followed 392 restaurant locations of five firms that adopted a theft-monitoring information system at different dates. Using difference-in-differences with staggered adoption, Pierce, Snow and McAfee found that monitoring reduced theft and raised productivity, and that the effects came mainly from changed behaviour among the existing staff rather than from turnover. They reported that the gains benefited both the firms and the legitimate tip-based earnings of workers (129, Pierce et al., 2015). The study shows that measurement can change what people do, quickly and in a direction both employer and worker can value. It did not measure strain, trust or retention over years.
The broader literature is less favourable. Eurofound's 2025 review of research on algorithmic management reports a meta-analysis of 63 studies of electronic employee monitoring which found no average gain in performance, together with lower job satisfaction, higher stress and slightly more counterproductive behaviour (150, Riso et al., 2025). The findings do not contradict each other. Monitoring that targets a specific misconduct can pay; monitoring as a general management method does not, on average, raise performance and does impose costs on the people monitored. Chapter 13 drew the consequence for M2 Evaluation.
Hiring: test scores against managers' discretion
Hoffman, Kahn and Li studied the introduction of a job test across 15 firms employing low-skilled service workers. Where managers faced similar applicant pools, those who appeared to hire against the test's recommendations ended up with worse average hires, which the authors read as evidence that managers often overrule the test because they are biased or mistaken, not only because they have better private information (163, Hoffman et al., 2018). The outcome they measured was how long the people hired stayed in the job, a meaningful measure in an industry where turnover is high and training takes weeks.
This is the chapter's strongest evidence that an algorithmic input can improve a management decision over a horizon longer than a quarter. It is also specific: a standardised test for entry-level service roles, with managers who kept the final say. It shows that a score can discipline noisy human judgement; it does not show that automated screening of every kind improves hiring, and it says nothing about fairness between groups, which Chapters 7 and 12 examined. In this book's terms it supports Level 1 Assisted for a screening input to an M3 Consequence decision, with a record of when and why the human decider departed from it, and no higher degree of delegation.
AI-assisted work: support, consulting, writing and software
Brynjolfsson, Li and Raymond studied the staggered introduction of a generative AI assistant among 5,172 customer-support agents. Access raised issues resolved per hour by 15 per cent on average: less experienced and lower-skilled agents improved both speed and quality, while the most experienced and highest-skilled saw small gains in speed and small declines in quality. The authors also report evidence of learning, and customers who were more polite and less likely to ask for a manager (23, Brynjolfsson et al., 2025).
In a pre-registered field experiment with 758 consultants, Dell'Acqua and colleagues found that on 18 tasks inside what they call the jagged frontier of AI capability, those with access to a large language model completed 12.2 per cent more tasks, 25.1 per cent faster and at substantially higher rated quality, with the largest gains for those who started below average. On a task chosen to lie outside the frontier, those with access were 19 percentage points less likely to reach a correct solution than those without (22, Dell'Acqua et al., 2023). Noy and Zhang found, in an online experiment with 453 college-educated professionals doing occupation-specific writing tasks, that access to a chatbot cut the time taken by about 40 per cent and raised graders' quality ratings by about 18 per cent (180, Noy & Zhang, 2023). In a laboratory task, developers with an AI pair programmer finished 55.8 per cent faster (20, Peng et al., 2023).
The counterweight is the randomised study by METR of 16 experienced open-source developers working on 246 tasks in mature projects they knew well. When AI tools were allowed, tasks took 19 per cent longer. The developers had forecast a 24 per cent reduction and afterwards estimated a 20 per cent reduction (21, Becker et al., 2025). Gains measured elsewhere do not transfer automatically to experienced people working on complex material they know well, and the people doing the work believed they were faster when they were slower. Any evaluation that relies on how managers or workers feel about productivity inherits that gap.
Three patterns run through this evidence. Gains are largest for novices on well-defined tasks and shrink, or reverse, for experts and on tasks beyond the system's competence. Quality can fall where people defer to the system on the wrong task. And almost every study measures outcomes over weeks or months; none follows the same workers for years to see whether the novices who gained most became experts.
The labour-market view
Humlum and Vestergaard linked two large adoption surveys from late 2023 and 2024, covering 11 occupations exposed to AI chatbots, about 25,000 workers and 7,000 workplaces, to Danish employer-employee records. They estimated precise zeros: no significant effect on earnings or recorded hours in any occupation, with average reported time savings of about 3 per cent. The March 2026 revision confirms the null effects two years after ChatGPT's launch and finds that what changes is the structure of work, including new tasks of AI oversight (184, Humlum & Vestergaard, 2025).
The Danish evidence does not test algorithmic management directly, but it sets a frame: gains large enough to transform organisations should leave a trace in hours or earnings, and two years in they had not.
What employers and workers report
The largest bodies of evidence on algorithmic management itself are surveys. The OECD's survey of more than 6,000 firms in France, Germany, Italy, Japan, Spain and the United States found algorithmic management tools already common in most of the countries studied. Managers reported that the tools often improved the quality of their decisions and their own job satisfaction, and they also reported concerns about trustworthiness: unclear accountability, difficulty in following the tools' logic and inadequate protection of workers' health (149, Milanez et al., 2025). Those are perceptions of the people who adopted the tools, not measured outcomes.
Workers' reports differ. The OECD Employment Outlook 2023 surveyed workers and employers in finance and manufacturing in seven OECD countries before generative AI spread; workers and employers reported that AI could reduce tedious and dangerous tasks, while workers also reported concerns that AI was increasing their work pace and about their privacy (146, OECD, 2023). The JRC's AMPWork survey of about 6,500 respondents in Germany and Spain found that greater exposure to algorithmic management was correlated with reports of increased workload and a faster pace of work (145, Fernández-Macías et al., 2023). Eurofound's review reports a European Commission study of 2025 in which about 62 per cent of a small, non-representative sample of employers saw positive effects on working time and productivity, while 35 per cent of surveyed workers felt it improved their productivity and 22 per cent that it harmed it (150, Riso et al., 2025).
The case studies add the most important qualification. The joint ILO and JRC study in logistics and healthcare found a generally positive effect on job quality in the Italian and French cases and clear evidence of more monitoring and work intensity in the South African cases, and concluded that effects are at least partly mediated by institutional and regulatory frameworks, with social dialogue key to mitigating harm (147, International Labour Organization, 2024). Eurofound's review reports a Finnish case study in which gains were most evident where workers, unions and management collaborated, and concludes that where protections are weaker, initial efficiency gains may be offset by stress, lower morale and higher turnover that undermine long-term productivity. It also reports the OECD's finding that employers who consulted workers or their representatives were significantly more likely to report positive effects of AI on performance and working conditions, although fewer than half did so (150, Riso et al., 2025).
The comparison that is usually missing: the human manager
Evaluations of algorithmic management rarely state their comparison. It is implicitly the human manager, whose quality varies widely and matters. Google's Project Oxygen, which began from the hypothesis that managers do not matter, analysed more than 10,000 data points from reviews and feedback surveys and found that teams with highly effective managers were more likely to achieve better results, be happier and have lower turnover, with coaching and empowering the team without micromanaging among the behaviours that mattered (95, Google re:Work, n.d.). Gallup reports that global employee engagement fell from 23 to 21 per cent in 2024, that managers' own engagement fell from 30 to 27 per cent, and that managers who received best-practice training saw management performance metrics improve by 20 to 28 per cent (153, Gallup, 2025). Neither is a controlled study, and both come from organisations with an interest in the conclusion; together they support a modest point: the manager effect is real, the human baseline is uneven, and a system that replaces a poor manager's direction may raise performance while one that replaces a good manager's coaching may lower it.
Scheduling shows the point from the other side. In a randomised experiment in 28 stores of a United States retailer over nine months, scheduling practices designed to improve consistency, predictability, adequacy and employee control raised store productivity by 5.1 per cent, through higher sales and lower labour hours (221, Kesavan et al., 2022). The intervention was not AI, but it shows that M1 Direction designed around workers' needs can pay in output as well as wellbeing.
Gaming, ironies and the crowding out of quality
Campbell argued that the more any quantitative social indicator is used for decision-making, the more it is subject to corruption pressures and the more it distorts the processes it was meant to monitor (110, Campbell, 1979). Strathern stated the same mechanism in the form now usually given as Goodhart's law: "When a measure becomes a target, it ceases to be a good measure" (228, Strathern, 1997). Muller documented the pattern across schools, hospitals, police forces and firms: metrics that start as aids to judgement become substitutes for it, and what is not counted, often the quality that mattered most, is neglected (123, Muller, 2018). AI Threat, Chapter 22, examined the machine version, specification gaming, in which a system delivers what its objective measures rather than what was intended (44, Nordqvist, 2026). Algorithmic management combines the two: a system optimises a metric, and the people it directs learn to optimise the same metric.
The mechanism takes time. In the first quarter a new measure still reflects the work; within a year people have learnt which claims close fastest and which tasks the dashboard does not see. A claims handler measured on throughput has reason to close a claim early and let it reopen; a home-care worker measured on time per visit has reason to cut the conversation that the visit plan does not record. Neither acts in bad faith; each responds to the measure the organisation chose. The lost quality appears, if at all, in another department's metric, after the quarter in which the gain was reported.
Bainbridge's ironies of automation add a second delayed cost. Automation leaves people the hardest tasks while removing the routine practice that kept them able to do them, and asks them to monitor a system they no longer operate (24, Bainbridge, 1983). For M4 Development the irony applies twice. Workers whose method is set by a system practise less judgement. Team leaders whose allocation, scheduling and first-line review are done by a system practise less management, and the junior tasks through which people learnt to manage disappear. That is open question Q5, which Chapter 19 takes up; its cost cannot appear in an evaluation shorter than the time it takes to grow a manager.
Westrum's typology explains why gaming is hard to see from above: in pathological and bureaucratic cultures unwelcome information is hidden or ignored, while in generative cultures it flows to where it is needed (18, Westrum, 2004). A system that ties consequences to individual metrics pushes towards the first two by giving people reason to keep bad news out of the metric. That is one more reason to report its figures at team level and keep M3 Consequence decisions away from them.
Quarters and years
The evidence diverges by horizon. Output effects measured at introduction are real and, for novices on well-defined tasks, large. The costs that the measurement literature predicts, gaming, drift in unmeasured quality, strain, turnover and the loss of learning, arrive later and are rarely measured. That does not show that the costs exceed the gains; it shows that the evidence most organisations collect cannot answer the question.
Evidence over years would have four properties. It would use a comparison group that has not yet received the system, ideally through a roll-out staggered by a rule fixed in advance, as in the restaurant and customer-support studies. It would measure the six outcomes, not only output, with quality measured independently of the metric the system optimises. It would run for at least two years, long enough for gaming to develop and turnover to show. And it would be agreed in advance, with outcomes, thresholds and stop rules written down before the results were known, so that no party could choose the measure after seeing which way it pointed.
European law already points in this direction for some deployers. The AI Act requires deployers of high-risk AI systems to monitor their operation on the basis of the instructions for use (Article 26(5)), and employers to inform workers' representatives and affected workers before putting a high-risk system into service at the workplace (Article 26(7)) (1, European Union, 2024). Systems used to allocate tasks or to monitor and evaluate performance in work-related relationships are high-risk under Annex III, point 4(b), and the Digital Omnibus sets the date from which those obligations apply to Annex III systems at 2 December 2027 (2, European Union, 2026); that date is expected. The Platform Work Directive goes further for digital labour platforms: Article 10(1) requires them, with workers' representatives, regularly and at least every two years, to evaluate the impact of individual decisions taken or supported by automated systems on persons performing platform work, including on working conditions and equal treatment, and Article 12 requires an evaluation of those systems' safety and health risks (47, European Union, 2024). It does not apply to Nordvik Region or Hansa Mutual, but its two-year evaluation with representatives is a useful model for any employer. The Framework Directive requires employers to consult workers or their representatives on the planning and introduction of new technologies as regards their consequences for safety and health (Article 6(3)(c)) (49, Council of the European Communities, 1989), and in Germany the introduction of technical equipment suited to monitor behaviour or performance is subject to co-determination under BetrVG §87(1) no. 6, while §80(3) treats the works council's use of an expert as necessary where it must assess the introduction or application of AI (9, Germany, 2001). The organisational implication, not legal advice, is that the evaluation design belongs in the information, consultation or co-determination the law already requires.
Practical guide: Designing a multi-year evaluation of an AI system that performs management functions
Purpose. To find out whether a system performing M1 Direction, M2 Evaluation or M4 Development improves work over years, on outcomes agreed with workers' representatives before go-live.
Roles. The system owner, normally the HR director or the head of the business unit, is accountable. Line managers run the roll-out; HR supplies retention and sick-leave data. Workers' representatives (union, works council or safety representatives) agree outcomes, thresholds and reporting rules. The data protection officer checks that no outcome needs individual figures. An analyst outside the management line of the units evaluated runs the analysis. The workers affected learn of the evaluation in the notice that tells them about the system.
Steps.
- Write down the decision the evaluation informs. For example extending the system, changing its delegation profile or withdrawing it, and who takes that decision.
- Name at least one outcome in each of the six categories. Reject any plan whose only primary outcome is the metric the system optimises.
- Choose the comparison before the roll-out. Default: at least three waves, units assigned by lot or a rule fixed in advance, later waves as the comparison. Where staggering is impossible, use matched teams and a baseline of at least six months.
- Set the horizon. Default: at least 24 months from the first wave, with interim reviews every six months. Retention and learning outcomes are not judged before month 18.
- Fix thresholds and stop rules. For each quality, safety and retention outcome, state the deterioration against the comparison that pauses further roll-out, for example a rise of more than 10 per cent sustained over two quarters. A stop rule pauses the next wave; it never triggers a decision about an individual.
- Agree the reporting rules. Report at unit or team level only, default minimum group size ten. No evaluation figure may feed an M3 Consequence decision. Adapt the minimum and access rules to the collective agreement or works agreement.
- Record the agreed plan as a versioned file and an AI Decision Record before the first wave, beside the system's delegation profile in the delegation register.
- Report and decide. Publish each six-monthly review to management and representatives at the same time, including outcomes that point the wrong way. At month 24, take and record the decision named in step 1.
Definition of done. A versioned plan with outcomes in all six categories, a comparison fixed before roll-out, a horizon of at least 24 months, stop rules, team-level reporting, the representatives' agreement recorded and an independent analyst named.
Worked example: evaluation plans for ShiftWise and the agent-boss pilot
The following plans are illustrative. Nordvik Region records its plan for ShiftWise in home care as AIDR-0603, beside the delegation profile DLG-NR-ROS-01 (AIDR-0602) that the Region negotiated with the unions before go-live. The supplier's proposed success measure, visits per paid hour in the first quarter, is kept as one output measure and explicitly rejected as the primary outcome.
# management/evaluations/EVP-NR-ROS-2027-01.yaml  (illustrative)
id: EVP-NR-ROS-2027-01
decision_record: AIDR-0603
system: ShiftWise
delegation_profile: DLG-NR-ROS-01
functions: [M1 Direction, M5 Care]
owner: HR director
analyst: internal audit, outside the home-care management line
decision_informed: extend ShiftWise routes to all home-care units, revise DLG-NR-ROS-01 or withdraw
rejected_primary_outcome:
  metric: visits per paid hour, first quarter
  reason: optimised by the system itself; says nothing about quality, health or retention
design:
  method: staggered roll-out by unit, later waves as comparison
  waves:
    - wave: 1
      units: [Strandvik, plus six units drawn by lot]   # seven units
      start: 2027-Q1
    - wave: 2
      units: half of the remaining units, drawn by lot
      start: 2027-Q3   # went live 2027-09-13 (Chapter 30)
    - wave: 3
      units: remaining units
      start: 2028-Q1
  baseline_months: 6
  horizon_months: 24
  interim_review_months: 6
outcomes:
  output: [visits completed per planned visit, overtime hours per FTE]
  quality: [missed visits, late visits over 30 minutes, care recipient complaints]
  health: [short-term sick-leave days per FTE, safety representative reports]
  retention: [voluntary turnover at 12 and 24 months]
  learning: [unit managers able to draft a four-week roster unaided, checked yearly]
  fairness_trust: [staff-rated fairness of routes, CNT-NR contestations per 100 staff]
stop_rules:
  - outcome: missed visits
    threshold: rise above 10 percent against comparison, two consecutive quarters
    action: pause next wave and review with unions
  - outcome: short-term sick-leave days per FTE
    threshold: rise above 10 percent against comparison, two consecutive quarters
    action: pause next wave and refer to central work-environment committee
reporting:
  level: unit
  minimum_group_size: 10
  individual_figures: none
  consequence_use: prohibited
agreed_with: [union for municipal and care workers, union for nurses and midwives, central work-environment committee]
Hansa Mutual records the evaluation of HM-AB-PILOT-01 as AIDR-0674, under the pilot's terms in AIDR-0652 and the delegation profile DLG-HM-AB-01. Its first draft measured claims closed per handler per quarter; the Konzernbetriebsrat pointed out that individual throughput figures go to team leaders only under KBV-IT-2024 and that throughput alone rewards claims that are closed early and reopened.
# management/evaluations/EVP-HM-AB-2027-01.yaml  (illustrative)
id: EVP-HM-AB-2027-01
decision_record: AIDR-0674
pilot: HM-AB-PILOT-01
pilot_terms: AIDR-0652
delegation_profile: DLG-HM-AB-01
mandate_manifest: MND-HM-CLM-01
functions: [M1 Direction, M2 Evaluation, M4 Development]
owner: chief HR officer
analyst: group internal audit
design:
  method: matched comparison
  treated: [Hamburg claims team in the pilot]
  comparison: three Hamburg motor and property claims teams outside the pilot
  baseline_months: 6
  horizon_months: 24
  interim_review_months: 6
outcomes:
  output: [claims closed per team per week]
  quality: [claims reopened within 90 days, complaint rate, subrogation letters corrected after review]
  health: [team wellbeing index, survey agreed with Konzernbetriebsrat]
  retention: [handler voluntary turnover at 12 and 24 months]
  learning: [seeded-error catch rate from OQM-HM-CLM-01, handlers able to draft recovery letters unaided]
  fairness_trust: [handler-rated fairness of allocation, MDR-HM reassignments by team leader]
stop_rules:
  - outcome: claims reopened within 90 days
    threshold: rise above 15 percent against comparison, two consecutive quarters
    action: return agents to Level 1 Assisted pending review
reporting:
  level: team
  minimum_group_size: 10
  individual_figures: none
  consequence_use: prohibited
  works_agreement: KBV-IT-2024
agreed_with: [Konzernbetriebsrat, Betriebsrat Hamburg]
Both plans fix comparison, outcomes and stop rules before the first result, report only at team or unit level and forbid the use of evaluation figures in decisions about people. Nordvik can stagger across many similar units; Hansa has one pilot team and relies on matched teams, a weaker design that the plan records as such.
The debate
The debate on whether algorithmic management works is often conducted between a vendor's case study and a union's survey. The four steps below give each position its strongest form from the evidence above.
The case for concern
The case for concern starts from the measurement literature. Every management system that ties attention or consequences to a metric creates pressure to move the metric rather than the work, and the pressure grows with time (110, Campbell, 1979) (123, Muller, 2018). Algorithmic management makes the metric continuous, individual and hard to argue with, which accelerates the mechanism. First-quarter gains are therefore the least informative evidence: they are measured on the metric the system optimises, before people have learnt to game it.
The second strand is the longer-run evidence that exists. Monitoring as a general method does not raise average performance and does raise stress (150, Riso et al., 2025). Workers report faster pace and more workload where algorithmic management is intense (146, OECD, 2023) (145, Fernández-Macías et al., 2023). Where protections are weak, initial efficiency gains are eroded by stress, morale and turnover. Managers who adopt the tools report better decisions while saying they cannot follow the tools' logic and do not know who is accountable (149, Milanez et al., 2025). The METR study shows how unreliable such perceptions can be (21, Becker et al., 2025).
The third strand is the pipeline. The controlled studies show that the largest gains go to novices, because the system supplies the know-how they lack (23, Brynjolfsson et al., 2025). Over years, that is also the mechanism by which novices may stop acquiring the know-how, and by which team leaders stop practising the allocation and review through which they learnt to manage (24, Bainbridge, 1983). The cost appears when the system fails or the next generation of experienced handlers and managers is needed, long after the evaluation has closed. On this view, algorithmic management may be reporting gains while consuming the capital that produced them: skill, trust and health.
The case for calm
The case for calm starts from the controlled evidence. In customer support, consulting and professional writing, assistance that shapes the method and pace of work raised output and, for most workers, quality, with the largest gains for the least experienced, which narrows differences in performance (23, Brynjolfsson et al., 2025) (22, Dell'Acqua et al., 2023) (180, Noy & Zhang, 2023). The restaurant study found that targeted monitoring raised productivity and workers' own tips without driving out staff (129, Pierce et al., 2015), and the hiring study found that following a structured score produced hires who stayed longer than those chosen against it (163, Hoffman et al., 2018). That is a measured outcome, not a perception.
The second strand is the comparison. Human management is uneven, sometimes biased and often absent where it is most needed: the night shift, the home-care route, the new handler whose team leader has twenty other people to support. The research on managers shows how much their quality matters (95, Google re:Work, n.d.), and the surveys show how many are disengaged and under strain (153, Gallup, 2025). A rostering system that applies working-time rules every time, or a screening score that resists a manager's prejudice, can be fairer and more reliable than the manager it assists. Scheduling designed around workers' needs has raised productivity in a randomised trial (221, Kesavan et al., 2022), and the case studies in Italy and France found job quality improved (147, International Labour Organization, 2024).
The third strand is that the harms are a matter of design, not of the technology. Gaming is a property of how metrics are used and predates algorithms by a century. Where implementation was negotiated, gains and welfare went together (150, Riso et al., 2025). The right response to the measurement literature is better measures and balanced use, not abandoning tools that measurably help less experienced workers do better work.
Where the positions meet
The positions agree on more than their advocates admit. Both accept that the controlled evidence is real, that it concerns mostly assistance rather than management, and that it is short-run. Both accept that gains are uneven. Both accept Campbell's mechanism and Bainbridge's ironies as what happens to metrics and systems left without design, and the strongest finding of the European case studies and surveys: outcomes depend on the institutional setting and on whether workers and their representatives took part in the design (147, International Labour Organization, 2024) (150, Riso et al., 2025).
They also agree on what is missing. There is almost no evidence that follows algorithmic management of the same workforce for several years and measures quality, health, retention and learning against a comparison chosen in advance. The concern describes what may be happening in that gap; the calm describes what is possible if design closes it.
What can be done
Employers can define success over years before deployment, include quality, health, retention and learning alongside output, and roll systems out in stages that leave a comparison group, following the practical guide above. They can refuse to treat the metric a system optimises as the measure of its success, and count the cost of keeping managers and workers practised in the business case rather than as waste.
Line managers can note what the system's figures do not show, such as the visit that took longer because the person was unwell, use the figures for the team rather than against individuals, and raise drift in unmeasured quality at each review.
Workers and their representatives can put the evaluation design on the agenda of the information, consultation or co-determination the law gives them, agree outcomes and stop rules, and insist that figures stay at team level and never feed consequence decisions. Where national law allows an expert, as BetrVG §80(3) does in Germany for AI, they can use one to check the design.
Public authorities and researchers can fund longitudinal studies that follow workforces over years, require evaluation plans in public procurement of AI that performs management functions, and publish the results. Labour inspectorates and market surveillance authorities can ask deployers for the monitoring evidence the AI Act already requires.
Verdict
On Q4, the evidence supports a divided verdict.
For M1 Direction through assistance that shapes how work is done, short-run gains in output and, for less experienced workers, in quality are observable in controlled studies, as are smaller or negative effects for experts and on tasks beyond the system's competence. That direction designed around workers' needs can raise output is observable in one randomised scheduling trial outside AI.
For M2 Evaluation, the gaming of metrics and the crowding out of unmeasured quality are observable as a pattern across sectors, and the absence of an average performance gain from general electronic monitoring is observable in meta-analytic evidence. That continuous algorithmic evaluation accelerates the pattern is expected, but unmeasured over years.
For M4 Development, the erosion of skill when automation removes practice is observable for ordinary automation; its effect on the pipeline of future managers when junior management work is automated is expected but not yet measured anywhere.
The long-run effects of algorithmic management as a whole on productivity, quality, health and retention are expected to be mixed and to depend on institutions and design, as the case studies suggest, but they are not yet measured. Claims of large, organisation-wide gains from AI that manages people are speculation: the best labour-market evidence finds no effect on hours or earnings two years in. Q4 therefore remains open, and most organisations deploying algorithmic management do not know whether it works, because they have not designed a way to find out.
What can be influenced is the decisive part: the outcomes chosen, the comparison kept, the horizon set, the stop rules agreed and the separation of evaluation figures from decisions about people. Each is chosen before deployment and can be agreed with the people who will be managed.
Across the usage modes
The evidence is weakest where delegation is greatest, which is where evaluation design matters most.
| Mode | Example in management | Evidence available | What is missing |
|---|---|---|---|
| Mode 0 Ambient AI | Collaboration analytics in an office suite | Monitoring meta-analyses; surveys of pace and stress | Any controlled study of performance effects |
| Mode 1 Conversational assistants | Managers drafting feedback or plans with a chatbot | Controlled writing and consulting experiments | Effects on the quality of management decisions |
| Mode 2 Embedded workplace assistants | Assistants that draft task lists with owners | Field studies of assistance in support work | Effects of assigned tasks on workload over years |
| Mode 3 Agentic work tools | Agents that do part of a worker's task | Developer studies, gains and a slowdown | Long-run effects on expertise |
| Mode 4 Built AI applications | Rostering, screening, performance dashboards | Employer surveys, case studies, one hiring study | Staggered, multi-year evaluations with quality and retention |
| Mode 5 Autonomous production agents | An agent allocating claims to handlers | Almost none | Everything; evaluate before scale |
Nordvik Region and Hansa Mutual
Nordvik Region first proposed to judge ShiftWise in home care by the measure in the supplier's business case, visits per paid hour in the first quarter. In the negotiation over DLG-NR-ROS-01, the safety representatives and the union for municipal and care workers objected that it would rise as soon as routes were tightened, whatever happened to care or staff. Ingrid Halvorsen, as owner of the commission AIDR-0600, replaced it with the plan in AIDR-0603: a roll-out staggered unit by unit, starting with Mikael Strand's Strandvik unit, so that units not yet using the system serve as the comparison, as the Region had done when it measured its staff assistant against a later roll-out wave (AI Governance, Chapter 16) (41, Nordqvist, 2026). Outcomes include missed visits, overtime, sick leave, turnover and staff-rated fairness over at least two years. As a public authority with many similar units, a tradition of negotiation and a work-environment committee that already reviews sick leave, the Region can afford a staggered design cheaply.
Hansa Mutual first proposed to judge HM-AB-PILOT-01 by claims closed per handler per quarter. Thomas Brandt, for the Konzernbetriebsrat, pointed out that individual figures go to team leaders only under KBV-IT-2024 and that a throughput measure would reward claims closed early and reopened later. The plan in AIDR-0674 evaluates Jana Petersen's team against comparable claims teams on throughput, reopened claims, complaint rates, handler turnover and a team-level wellbeing measure agreed with the Konzernbetriebsrat, with the seeded-error results of OQM-HM-CLM-01 as the learning outcome. One pilot team against matched teams is a weaker design than Nordvik's staggered roll-out, and the plan records that limitation. Both changed their measure for the same reason: the first one proposed was the one the system was built to move.
Summary
This chapter asked whether algorithmic management works, and over what horizon. It concerned M1 Direction, M2 Evaluation and M4 Development. The controlled evidence shows real short-run gains when AI shapes how work is done: in customer support, consulting, professional writing and well-defined programming, output rose and, for less experienced workers, so did quality. It also shows the limits: small or negative effects for experts, worse answers on tasks beyond the system's competence, and experienced developers who were slower with AI while believing they were faster. Targeted monitoring paid in one well-designed study; as a general method it shows no average performance gain and measurable stress.
The evidence on algorithmic management itself is mostly surveys and case studies. Managers report better decisions and concerns about accountability; workers report faster pace and more workload; the European case studies find that outcomes depend on institutions and on whether workers took part in the design.
Short-run gains and long-run performance diverge because a measure that becomes a target stops measuring, automation removes the practice that keeps people able to handle what it cannot, and the costs arrive after the quarter in which the gains are reported. The verdict on Q4 is that short-run gains and metric gaming are observable, long-run effects are expected to be mixed and are unmeasured, and claims of large organisation-wide gains are speculation.
The remedy is a multi-year evaluation agreed in advance with workers' representatives: six kinds of outcome, a comparison kept by staggered roll-out, at least two years, stop rules, and team-level figures that never feed a decision about a person. Nordvik Region and Hansa Mutual both began with quarterly throughput and both changed it.
Part III ends here. Chapter 16 opens Part IV by turning the question around: what happens when people become the managers of AI agents.
Sources
- European Parliament and Council of the European Union (2024). Regulation (EU) 2024/1689 laying down harmonised rules on artificial intelligence (Artificial Intelligence Act). Official Journal of the European Union. (1, European Union, 2024)
- European Parliament and Council of the European Union (2026). Regulation (EU) 2026/1744 amending Regulation (EU) 2024/1689 (Digital Omnibus on AI). Official Journal of the European Union. (2, European Union, 2026)
- Federal Republic of Germany (2001). Betriebsverfassungsgesetz (BetrVG). Gesetze im Internet. (9, Germany, 2001)
- Westrum, R. (2004). A typology of organisational cultures. Quality and Safety in Health Care. (18, Westrum, 2004)
- Peng, S., Kalliamvakou, E., Cihon, P. & Demirer, M. (2023). The Impact of AI on Developer Productivity: Evidence from GitHub Copilot. arXiv. (20, Peng et al., 2023)
- Becker, J., Rush, N., Barnes, E. & Rein, D. (2025). Measuring the Impact of Early-2025 AI on Experienced Open-Source Developer Productivity. METR. (21, Becker et al., 2025)
- Dell'Acqua, F. et al. (2023). Navigating the Jagged Technological Frontier: Field Experimental Evidence of the Effects of AI on Knowledge Worker Productivity and Quality. Harvard Business School. (22, Dell'Acqua et al., 2023)
- Brynjolfsson, E., Li, D. & Raymond, L. (2025). Generative AI at Work. The Quarterly Journal of Economics. (23, Brynjolfsson et al., 2025)
- Bainbridge, L. (1983). Ironies of automation. Automatica. (24, Bainbridge, 1983)
- Nordqvist, G. (2026). AI Governance: Governing Artificial Intelligence in European Enterprises and Public Authorities. The Architecture as Code Series, Book 2. (41, Nordqvist, 2026)
- Nordqvist, G. (2026). AI Threat: Are the Dystopias Coming True? Evidence, Risk and Response for European Enterprises and Public Authorities. The Architecture as Code Series, Book 5. (44, Nordqvist, 2026)
- European Parliament and Council of the European Union (2024). Directive (EU) 2024/2831 on improving working conditions in platform work. Official Journal of the European Union. (47, European Union, 2024)
- Council of the European Communities (1989). Council Directive 89/391/EEC on the introduction of measures to encourage improvements in the safety and health of workers at work. Official Journal of the European Communities. (49, Council of the European Communities, 1989)
- Google re:Work (n.d.). Following the data: The research behind great managers. Google. (95, Google re:Work, n.d.)
- Campbell, D. T. (1979). Assessing the impact of planned social change. Evaluation and Program Planning. (110, Campbell, 1979)
- Muller, J. Z. (2018). The Tyranny of Metrics. Princeton University Press. (123, Muller, 2018)
- Pierce, L., Snow, D. C. & McAfee, A. (2015). Cleaning House: The Impact of Information Technology Monitoring on Employee Theft and Productivity. Management Science. (129, Pierce et al., 2015)
- Fernández-Macías, E., Urzì Brancati, C., Wright, S. & Pesole, A. (2023). The platformisation of work: Evidence from the JRC Algorithmic Management and Platform Work survey (AMPWork). European Commission, Joint Research Centre. (145, Fernández-Macías et al., 2023)
- OECD (2023). OECD Employment Outlook 2023: Artificial Intelligence and the Labour Market. OECD Publishing. (146, OECD, 2023)
- International Labour Organization (2024). Algorithmic management practices in regular workplaces are already a reality. ILO. (147, International Labour Organization, 2024)
- Milanez, A., Lemmens, A. & Ruggiu, C. (2025). Algorithmic management in the workplace: New evidence from an OECD employer survey. OECD Publishing. (149, Milanez et al., 2025)
- Riso, S., Adăscăliţei, D. & Oosterwijk, G. R. (2025). Implications of algorithmic management for work, employment and social dialogue: Literature review. Eurofound. (150, Riso et al., 2025)
- Gallup (2025). Global Engagement Falls for the Second Time Since 2009. Gallup. (153, Gallup, 2025)
- Hoffman, M., Kahn, L. B. & Li, D. (2018). Discretion in Hiring. The Quarterly Journal of Economics. (163, Hoffman et al., 2018)
- Noy, S. & Zhang, W. (2023). Experimental evidence on the productivity effects of generative artificial intelligence. Science. (180, Noy & Zhang, 2023)
- Humlum, A. & Vestergaard, E. (2025). Large Language Models, Small Labor Market Effects. NBER Working Paper 33777. (184, Humlum & Vestergaard, 2025)
- Strathern, M. (1997). 'Improving ratings': audit in the British University system. European Review. (228, Strathern, 1997)
- Kesavan, S., Lambert, S. J., Williams, J. C. & Pendem, P. K. (2022). Doing Well by Doing Good: Improving Retail Store Performance with Responsible Scheduling Practices at the Gap, Inc. Management Science. (221, Kesavan et al., 2022)